How old are Orange County homes?
Updated . By the OakTend team.
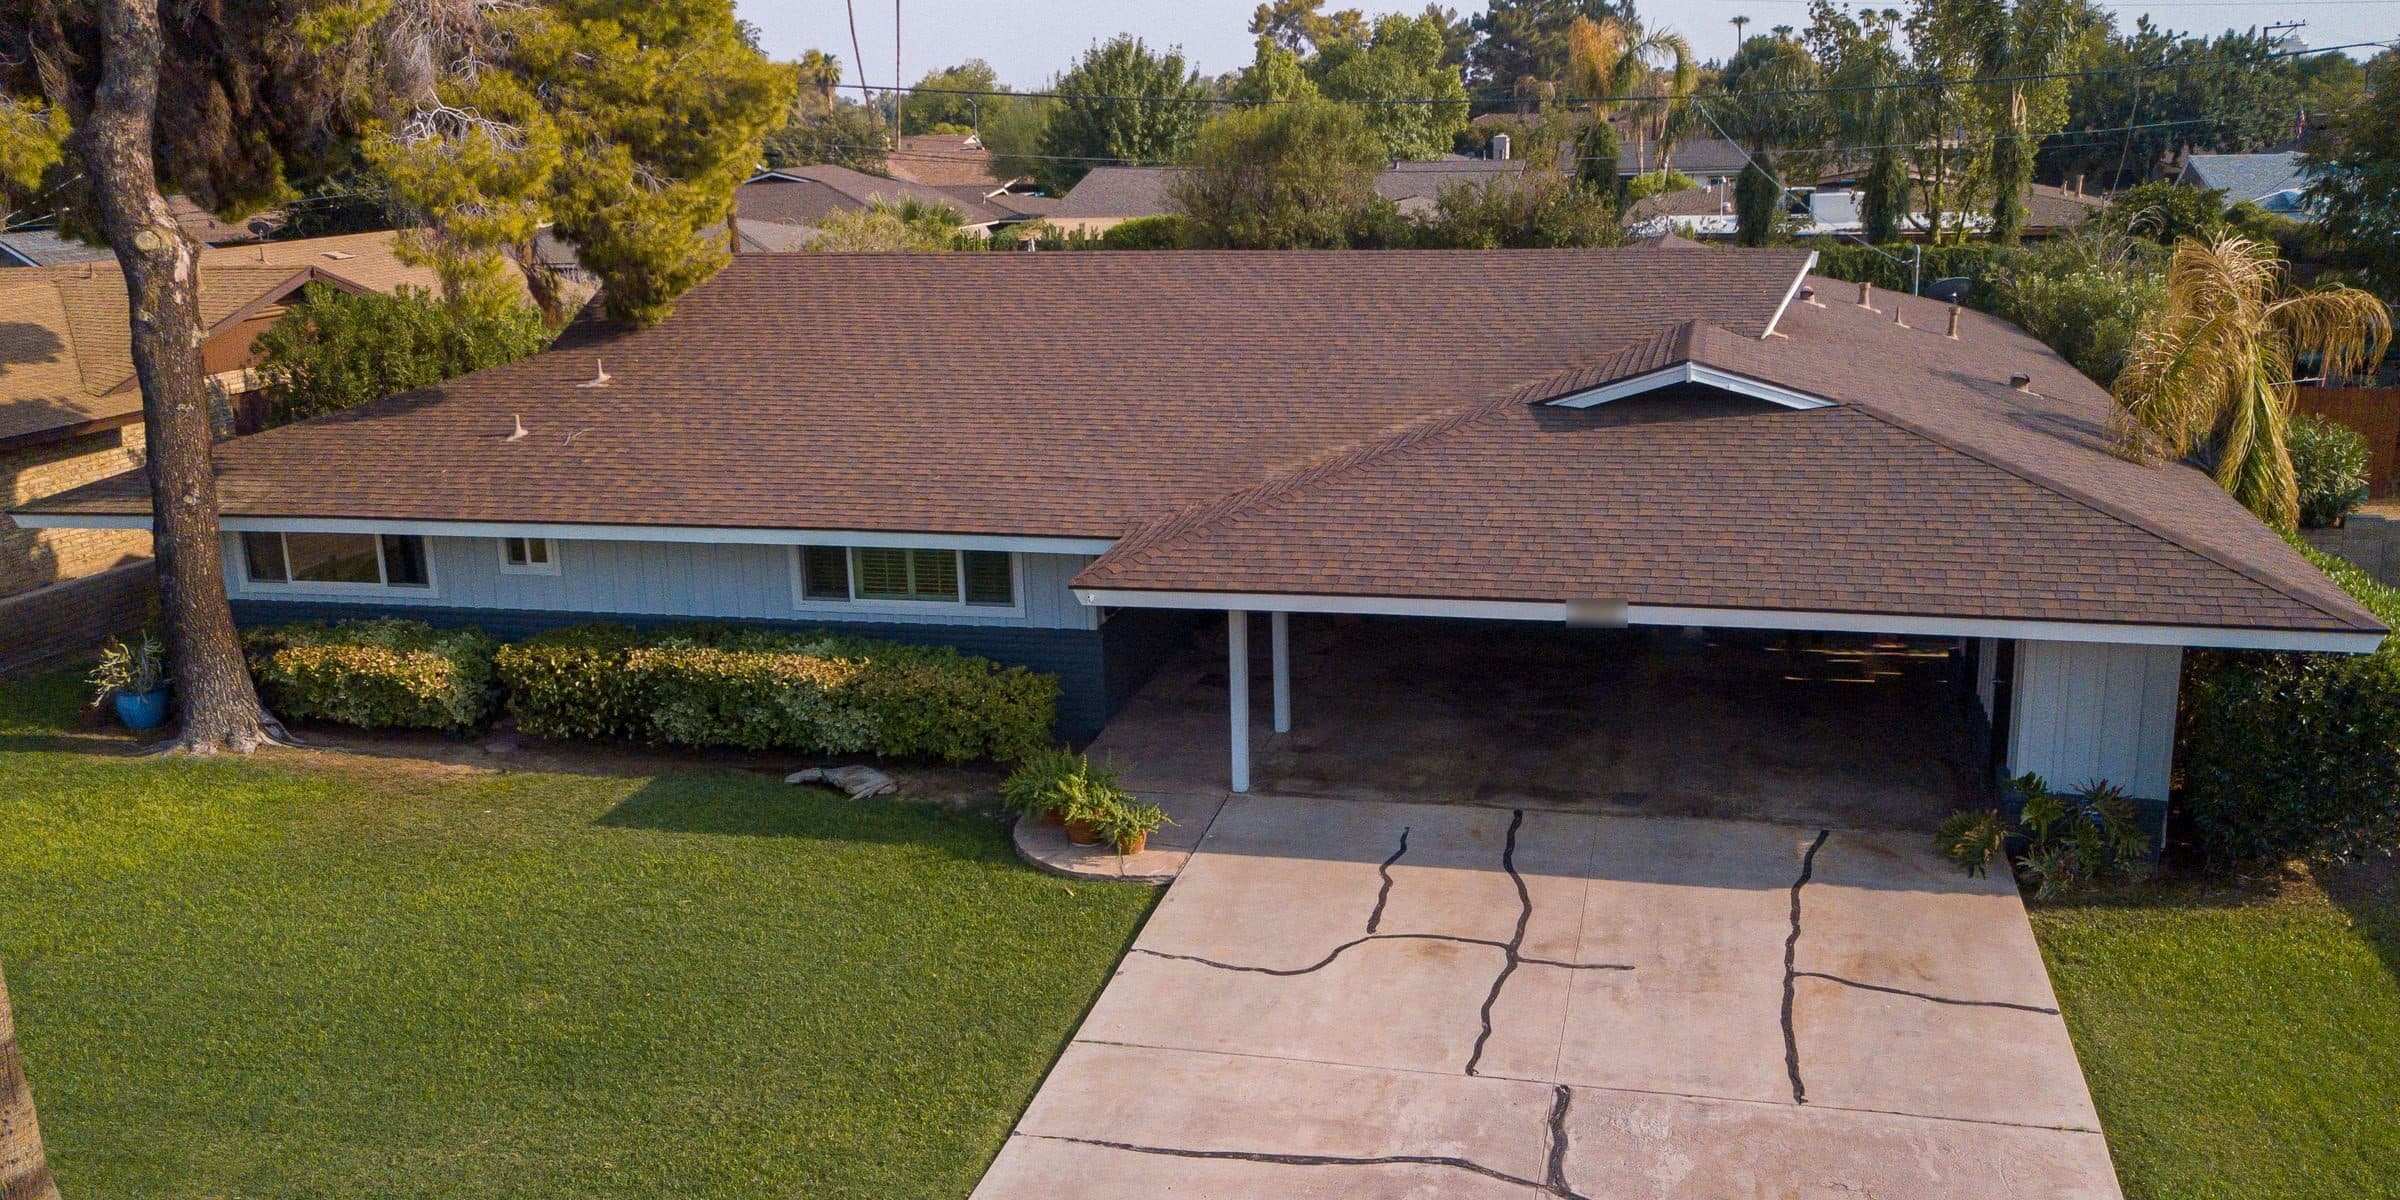
How old are the homes in each Orange County city?
Oldest first. "Built before 1980" is our sum of the 1979-and-earlier rows of Census table B25034, the year each structure was built. The plus or minus figure is our approximate margin of error for that share, worked out from the Census Bureau's published margins. Median year built is the Census Bureau's own figure, from table B25035. Every row counts all housing units, owned and rented, houses and apartments.
Built before 1980: 89.7% (plus or minus 5.0). Built 2000 or later: 1.7%.
Median year built: 1969. Housing units: 13,336.
Built before 1980: 88.9% (plus or minus 3.5). Built 2000 or later: 5.0%.
Median year built: 1966. Housing units: 14,632.
Built before 1980: 82.3% (plus or minus 3.0). Built 2000 or later: 5.6%.
Median year built: 1972. Housing units: 19,227.
Built before 1980: 81.5% (plus or minus 10.8). Built 2000 or later: 4.3%.
Median year built: 1974. Housing units: 1,971.
Built before 1980: 81.1% (plus or minus 6.5). Built 2000 or later: 8.0%.
Median year built: 1972. Housing units: 5,206.
Built before 1980: 77.4% (plus or minus 2.2). Built 2000 or later: 7.2%.
Median year built: 1965. Housing units: 50,960.
Built before 1980: 76.6% (plus or minus 3.7). Built 2000 or later: 7.7%.
Median year built: 1968. Housing units: 21,225.
Built before 1980: 76.2% (plus or minus 3.3). Built 2000 or later: 9.5%.
Median year built: 1965. Housing units: 24,877.
Built before 1980: 75.8% (plus or minus 4.1). Built 2000 or later: 9.6%.
Median year built: 1971. Housing units: 16,920.
Built before 1980: 75.8% (plus or minus 3.2). Built 2000 or later: 8.9%.
Median year built: 1971. Housing units: 29,269.
Built before 1980: 75.6% (plus or minus 4.9). Built 2000 or later: 8.9%.
Median year built: 1964. Housing units: 13,598.
Built before 1980: 73.9% (plus or minus 2.2). Built 2000 or later: 11.1%.
Median year built: 1969. Housing units: 83,701.
Built before 1980: 71.3% (plus or minus 2.4). Built 2000 or later: 13.0%.
Median year built: 1969. Housing units: 50,344.
Built before 1980: 70.5% (plus or minus 7.3). Built 2000 or later: 10.4%.
Median year built: 1970. Housing units: 4,623.
Built before 1980: 69.2% (plus or minus 1.6). Built 2000 or later: 10.3%.
Median year built: 1974. Housing units: 82,624.
Built before 1980: 68.3% (plus or minus 2.4). Built 2000 or later: 11.0%.
Median year built: 1972. Housing units: 44,427.
Built before 1980: 65.2% (plus or minus 4.2). Built 2000 or later: 12.6%.
Median year built: 1975. Housing units: 13,269.
Built before 1980: 65.1% (plus or minus 1.8). Built 2000 or later: 14.3%.
Median year built: 1973. Housing units: 110,705.
Built before 1980: 64.3% (plus or minus 2.6). Built 2000 or later: 12.7%.
Median year built: 1973. Housing units: 46,952.
Built before 1980: 59.5% (plus or minus 3.1). Built 2000 or later: 14.3%.
Median year built: 1976. Housing units: 17,890.
Built before 1980: 54.9% (plus or minus 3.0). Built 2000 or later: 19.0%.
Median year built: 1978. Housing units: 45,185.
Built before 1980: 54.5% (plus or minus 4.0). Built 2000 or later: 24.9%.
Median year built: 1978. Housing units: 17,373.
Built before 1980: 53.1% (plus or minus 4.7). Built 2000 or later: 7.6%.
Median year built: 1979. Housing units: 16,484.
Built before 1980: 52.7% (plus or minus 4.4). Built 2000 or later: 17.1%.
Median year built: 1979. Housing units: 13,071.
Built before 1980: 52.2% (plus or minus 1.9). Built 2000 or later: 7.9%.
Median year built: 1979. Housing units: 34,285.
Built before 1980: 48.3% (plus or minus 4.4). Built 2000 or later: 6.4%.
Median year built: 1980. Housing units: 12,072.
Built before 1980: 47.2% (plus or minus 2.8). Built 2000 or later: 21.2%.
Median year built: 1983. Housing units: 28,482.
Built before 1980: 43.5% (plus or minus 3.0). Built 2000 or later: 25.5%.
Median year built: 1983. Housing units: 27,058.
Built before 1980: 39.4% (plus or minus 2.7). Built 2000 or later: 20.2%.
Median year built: 1984. Housing units: 23,887.
Built before 1980: 38.0% (plus or minus 1.9). Built 2000 or later: 15.2%.
Median year built: 1984. Housing units: 31,821.
Built before 1980: 23.8% (plus or minus 2.0). Built 2000 or later: 12.0%.
Median year built: 1986. Housing units: 27,643.
Built before 1980: 20.7% (plus or minus 0.9). Built 2000 or later: 53.1%.
Median year built: 2002. Housing units: 120,206.
Built before 1980: 5.6% (plus or minus 1.3). Built 2000 or later: 23.9%.
Median year built: 1995. Housing units: 20,507.
Built before 1980: 4.3% (plus or minus 1.3). Built 2000 or later: 9.8%.
Median year built: 1992. Housing units: 17,498.
| City | Built before 1980 | Built 2000 or later | Median year built | Housing units |
|---|---|---|---|---|
| Orange County (all) | 56.8% ±0.5 | 17.7% | 1977 | 1,146,169 |
| Laguna Woods | 89.7% ±5.0 | 1.7% | 1969 | 13,336 |
| Seal Beach | 88.9% ±3.5 | 5.0% | 1966 | 14,632 |
| Fountain Valley | 82.3% ±3.0 | 5.6% | 1972 | 19,227 |
| Villa Park | 81.5% ±10.8 | 4.3% | 1974 | 1,971 |
| La Palma | 81.1% ±6.5 | 8.0% | 1972 | 5,206 |
| Garden Grove | 77.4% ±2.2 | 7.2% | 1965 | 50,960 |
| La Habra | 76.6% ±3.7 | 7.7% | 1968 | 21,225 |
| Buena Park | 76.2% ±3.3 | 9.5% | 1965 | 24,877 |
| Cypress | 75.8% ±4.1 | 9.6% | 1971 | 16,920 |
| Westminster | 75.8% ±3.2 | 8.9% | 1971 | 29,269 |
| Laguna Beach | 75.6% ±4.9 | 8.9% | 1964 | 13,598 |
| Santa Ana | 73.9% ±2.2 | 11.1% | 1969 | 83,701 |
| Fullerton | 71.3% ±2.4 | 13.0% | 1969 | 50,344 |
| Los Alamitos | 70.5% ±7.3 | 10.4% | 1970 | 4,623 |
| Huntington Beach | 69.2% ±1.6 | 10.3% | 1974 | 82,624 |
| Costa Mesa | 68.3% ±2.4 | 11.0% | 1972 | 44,427 |
| Stanton | 65.2% ±4.2 | 12.6% | 1975 | 13,269 |
| Anaheim | 65.1% ±1.8 | 14.3% | 1973 | 110,705 |
| Orange | 64.3% ±2.6 | 12.7% | 1973 | 46,952 |
| Placentia | 59.5% ±3.1 | 14.3% | 1976 | 17,890 |
| Newport Beach | 54.9% ±3.0 | 19.0% | 1978 | 45,185 |
| Brea | 54.5% ±4.0 | 24.9% | 1978 | 17,373 |
| Dana Point | 53.1% ±4.7 | 7.6% | 1979 | 16,484 |
| San Juan Capistrano | 52.7% ±4.4 | 17.1% | 1979 | 13,071 |
| Mission Viejo | 52.2% ±1.9 | 7.9% | 1979 | 34,285 |
| Laguna Hills | 48.3% ±4.4 | 6.4% | 1980 | 12,072 |
| Tustin | 47.2% ±2.8 | 21.2% | 1983 | 28,482 |
| San Clemente | 43.5% ±3.0 | 25.5% | 1983 | 27,058 |
| Yorba Linda | 39.4% ±2.7 | 20.2% | 1984 | 23,887 |
| Lake Forest | 38.0% ±1.9 | 15.2% | 1984 | 31,821 |
| Laguna Niguel | 23.8% ±2.0 | 12.0% | 1986 | 27,643 |
| Irvine | 20.7% ±0.9 | 53.1% | 2002 | 120,206 |
| Aliso Viejo | 5.6% ±1.3 | 23.9% | 1995 | 20,507 |
| Rancho Santa Margarita | 4.3% ±1.3 | 9.8% | 1992 | 17,498 |
Source: the Census tables above, through Census Reporter. Incorporated cities only; unincorporated communities such as Ladera Ranch are left out. You are welcome to cite this table; please link back to this page.
Which Orange County cities have the oldest and newest homes?
Most of the oldest housing is in north and west county cities, plus a few coastal and retirement communities. Laguna Woods tops the list at 89.7% built before 1980, followed by Seal Beach and Fountain Valley, where more than four in five homes predate 1980. Garden Grove and Buena Park have the earliest median year built of any city with more than 20,000 homes: 1965.
The newest housing is in the planned communities of south county. In Rancho Santa Margarita and Aliso Viejo, about one home in twenty was built before 1980. Irvine is the only city where more than half of all housing units were built in 2000 or later, and its median home dates from 2002. Huntington Beach and Anaheim, two of the county's four largest cities by housing units, both sit above the county figure, at about two thirds built before 1980.
A city figure is an average across very different streets. A 1960s tract and a 2015 infill project can sit a block apart, so the year on your own property record matters more than your city's row.
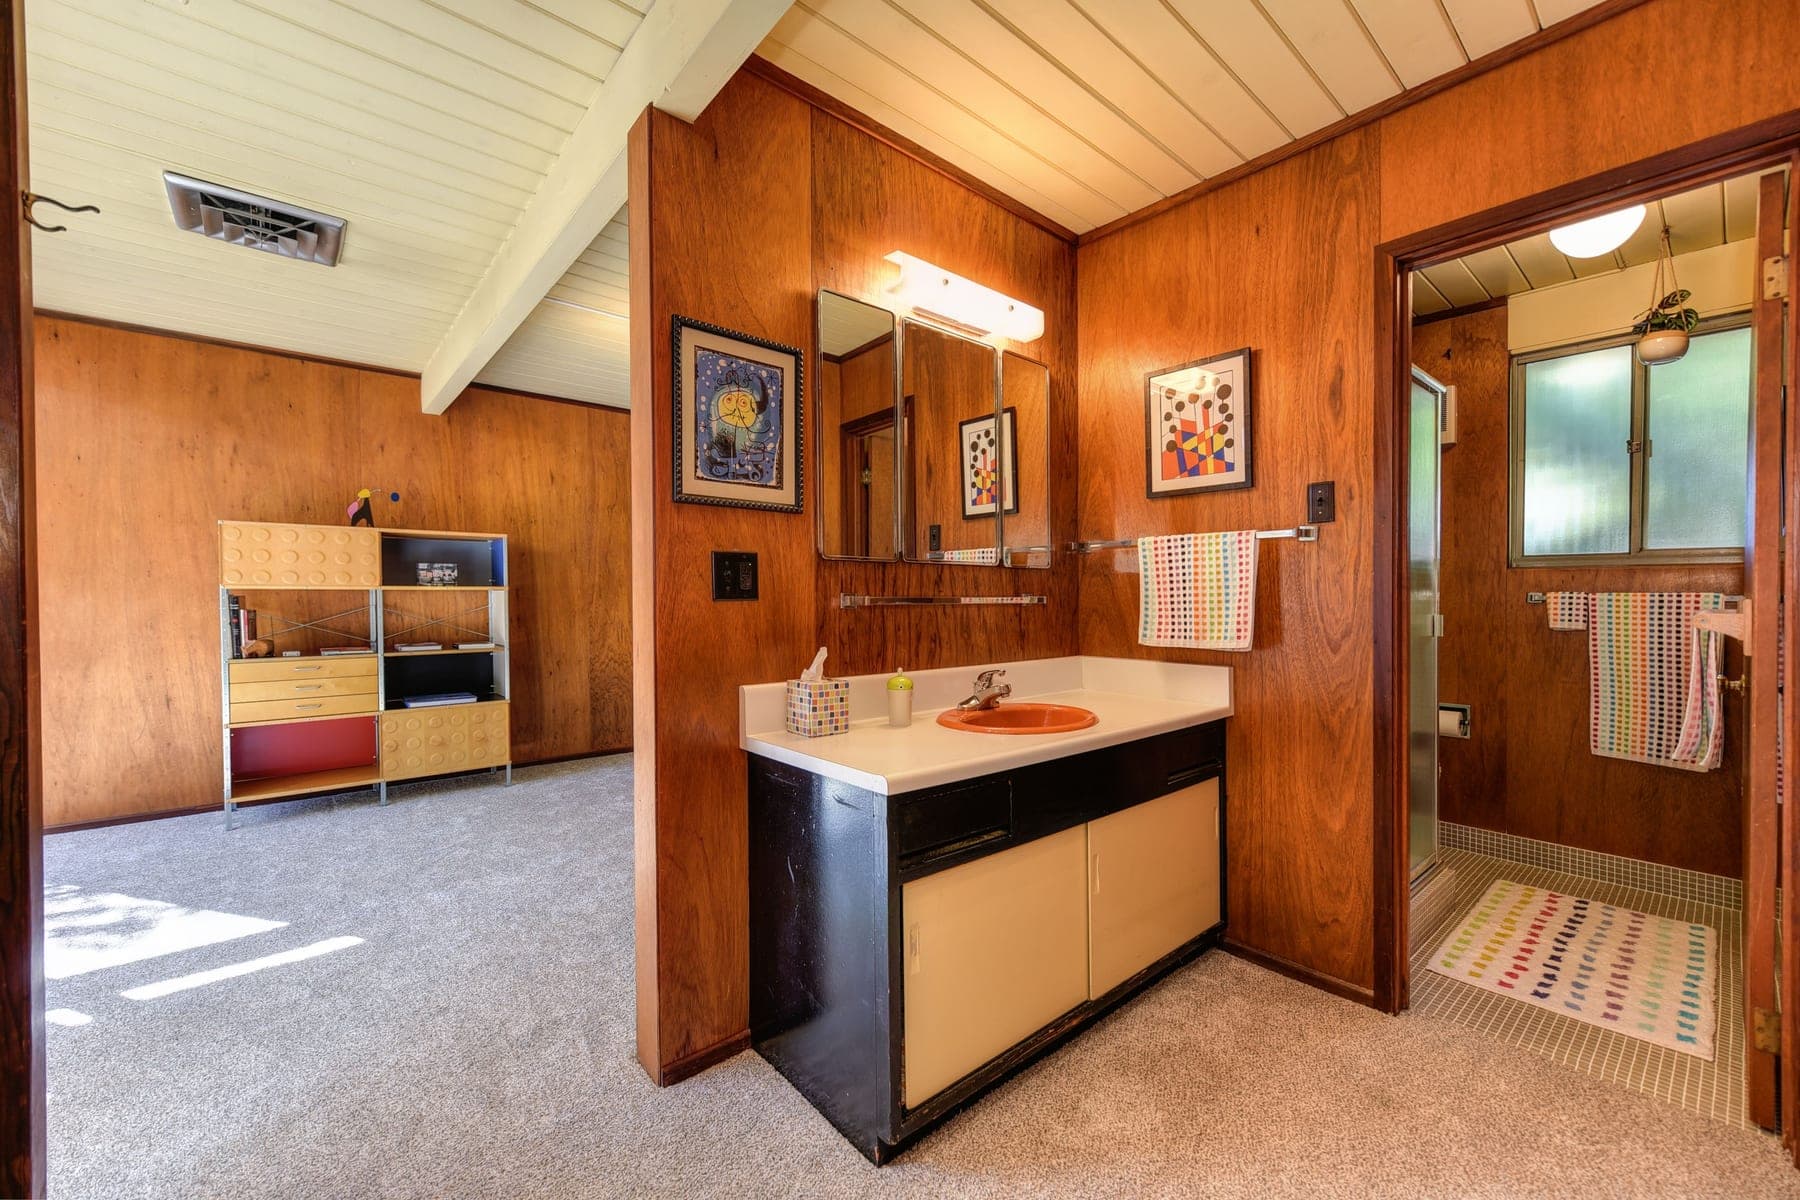
What does the age of a home mean for maintenance?
Build year is a clue, not a diagnosis. Houses get rewired, repiped and remodeled, so treat each of these as a question to ask about your house.
Older homes: drains and water lines
If your drains are cast iron, know their age. InterNACHI, a home inspectors' association, puts the typical life of cast iron waste pipe at about 60 years above ground and 50 to 60 years below ground, and says its chart is a general guideline, not a guarantee. Some older homes also have galvanized steel water pipe; we found no official source for when Orange County builders stopped using it or how long it lasts, so ask an inspector what your supply lines are made of. Our repiping guide and slab leak signs cover what to watch for, and slab leak repair in Orange County covers the fix.
1965 to the mid 1970s: aluminum wiring
The U.S. Consumer Product Safety Commission says wiring installed between 1965 and the mid 1970s may be aluminum. Our electrical panel guide covers the fire risk and what to ask an electrician.
Built before 1978: lead paint
The EPA's Renovation, Repair and Painting rule says anyone paid to do work that disturbs painted surfaces in a home built before 1978 must be certified, and their workers trained in lead-safe practices. Ask for the firm's certification before the work starts.
Built in 1980 or earlier: presumed asbestos
Under California's construction asbestos rule, Title 8 section 1529, thermal system insulation and surfacing material in a building constructed no later than 1980 is presumed to contain asbestos unless testing shows otherwise. Surfacing material includes sprayed or troweled-on finishes such as acoustical plaster on ceilings. Test before a remodel disturbs it. Note that this rule reaches one year past the table's "before 1980" line, so a 1980 house is covered too. Our kitchen and bathroom remodel guides cover what that adds to a project.
Built before 1980 on a raised foundation: earthquake retrofit
These homes may qualify for an Earthquake Brace + Bolt grant; see our earthquake retrofit guide.
OakTend keeps the year your home was built next to the age of each system, so the reminders you get fit your house rather than an average one.
Add your home, freeHow accurate are these numbers?
They are estimates from a survey, not a count. The Census Bureau says all American Community Survey figures are estimates because they come from a sample, and it publishes a margin of error with each one at a 90 percent confidence level. For big cities the margin on the pre-1980 share is small: plus or minus 0.5 points for the county and under one point for Irvine. For the smallest cities it is wide. Villa Park, with under 2,000 homes, carries about plus or minus 11 points, so two small cities a few points apart may not really differ.
The figures describe 2020 to 2024 as a five-year period, not any single year. The Census Bureau advises against comparing 5-year periods that overlap, so do not set this table against the 2019 to 2023 release to measure change.
What should I check first in an older Orange County home?
Start with the systems that fail expensively or quietly: the electrical panel and wiring, the water heater, the supply pipes and drains, and the roof. Our Orange County maintenance checklist puts them on a month by month calendar, and the new homeowner checklist covers what to find in your first week. Before any remodel on a pre-1980 house, read our permits guide, since testing and lead-safe work add steps. Local notes for every city are on the Orange County hub.
The pre-1980 share, the 2000-or-later share and their margins are our own sums of the published Census rows. This is general information, not an inspection, legal or safety advice for your home.
Sources
- Census Reporter: U.S. Census Bureau American Community Survey 5-year estimates 2020-2024, table B25034 (year structure built), Orange County and every place in it
Housing units by decade built, with margins of error, for the county and all 34 cities. The pre-1980 and 2000-or-later shares on the page are our sums of these rows: Orange County 56.8 percent built before 1980, Laguna Woods 89.7, Fountain Valley 82.3, Garden Grove 77.4, Huntington Beach 69.2, Newport Beach 54.9, Irvine 20.7, Rancho Santa Margarita 4.3. - Census Reporter: U.S. Census Bureau American Community Survey 5-year estimates 2020-2024, table B25035 (median year structure built)
Median year built as published: Orange County 1977, Garden Grove and Buena Park 1965, Irvine 2002. - U.S. Census Bureau: comparing ACS data
All ACS data are estimates because they come from a sample, a margin of error is published for every estimate, and overlapping 5-year periods should not be compared. - U.S. Census Bureau: Understanding and Using ACS Data, chapter 7 (understanding error)
The margins of error for published ACS estimates are provided at a 90 percent confidence level. - U.S. Consumer Product Safety Commission: Repairing Aluminum Wiring, Publication 516 (June 2011)
Wiring installed between 1965 and the mid 1970s may be aluminum. - Cal/OSHA: California Code of Regulations, Title 8, section 1529 (asbestos in construction)
Thermal system insulation and surfacing material, such as acoustical plaster on ceilings, in buildings constructed no later than 1980 is presumed to contain asbestos unless rebutted. - U.S. EPA: Lead Renovation, Repair and Painting Program
Anyone paid to do work that disturbs painted surfaces in homes built before 1978 must be certified and their employees trained. - InterNACHI: standard estimated life expectancy chart for homes
Cast iron waste pipe about 60 years above ground and 50 to 60 years below ground, as a general guideline and not a guarantee. - California Residential Mitigation Program: Earthquake Brace + Bolt retrofit
Grants of up to $3,000 for wood-framed homes built before 1980 on a raised foundation in listed ZIP codes; the retrofit bolts the house to its foundation, braces cripple walls with plywood and requires a strapped water heater.